Blog
🌸 Spring Cleaning at Vantage!
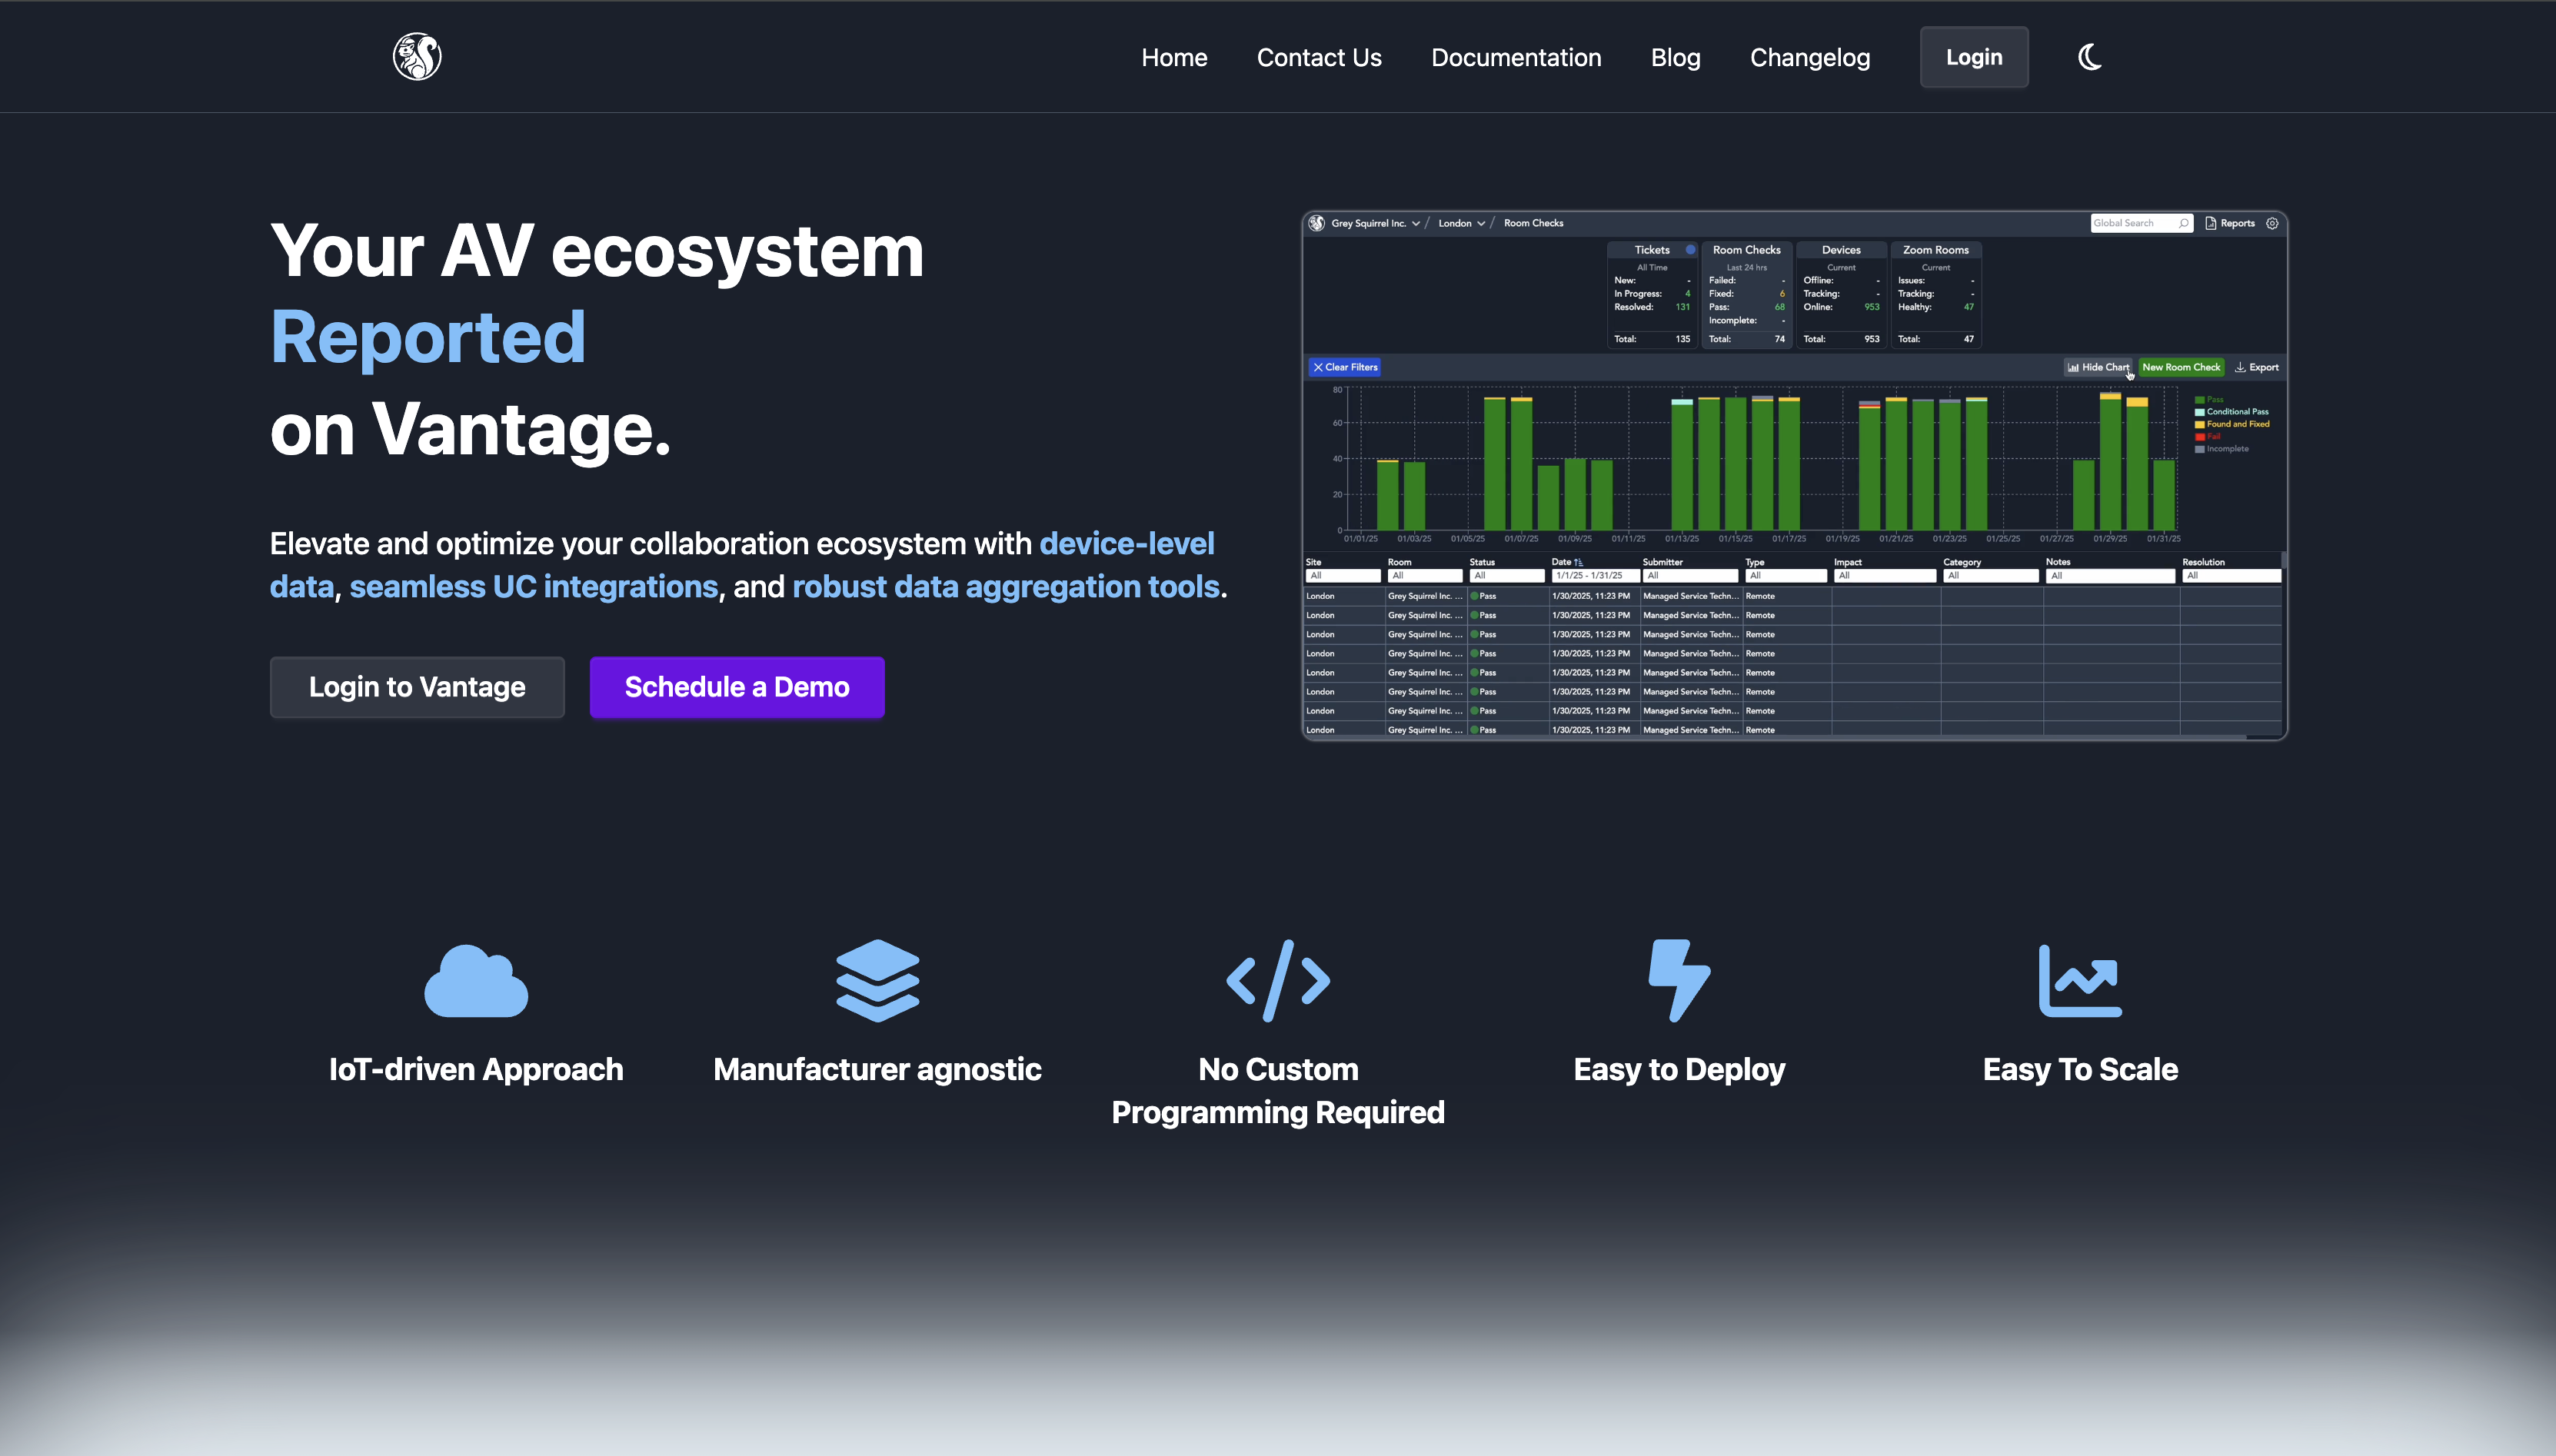
We’re starting the season fresh—with a new home! Vantage has moved from service.presentationproducts.com to vantageportal.com.
🏡 Welcome to the Portal
Our new site brings everything together: blog, changelog, documentation, and direct access to your Vantage portal—all in one place.

👀 Explore What’s Possible
We’ve updated the landing page with deeper insights into our core services.
If something sparks your interest, reach out to your customer service rep to learn how your organization can benefit.
We’re excited to welcome you to our new home and continue delivering the service you rely on.
Catch up on all the latest in our changelogs!
~April 15, 2025
Dig Deeper into your AV Data with Vantage!
🔍 Dashboard Column Filtering!
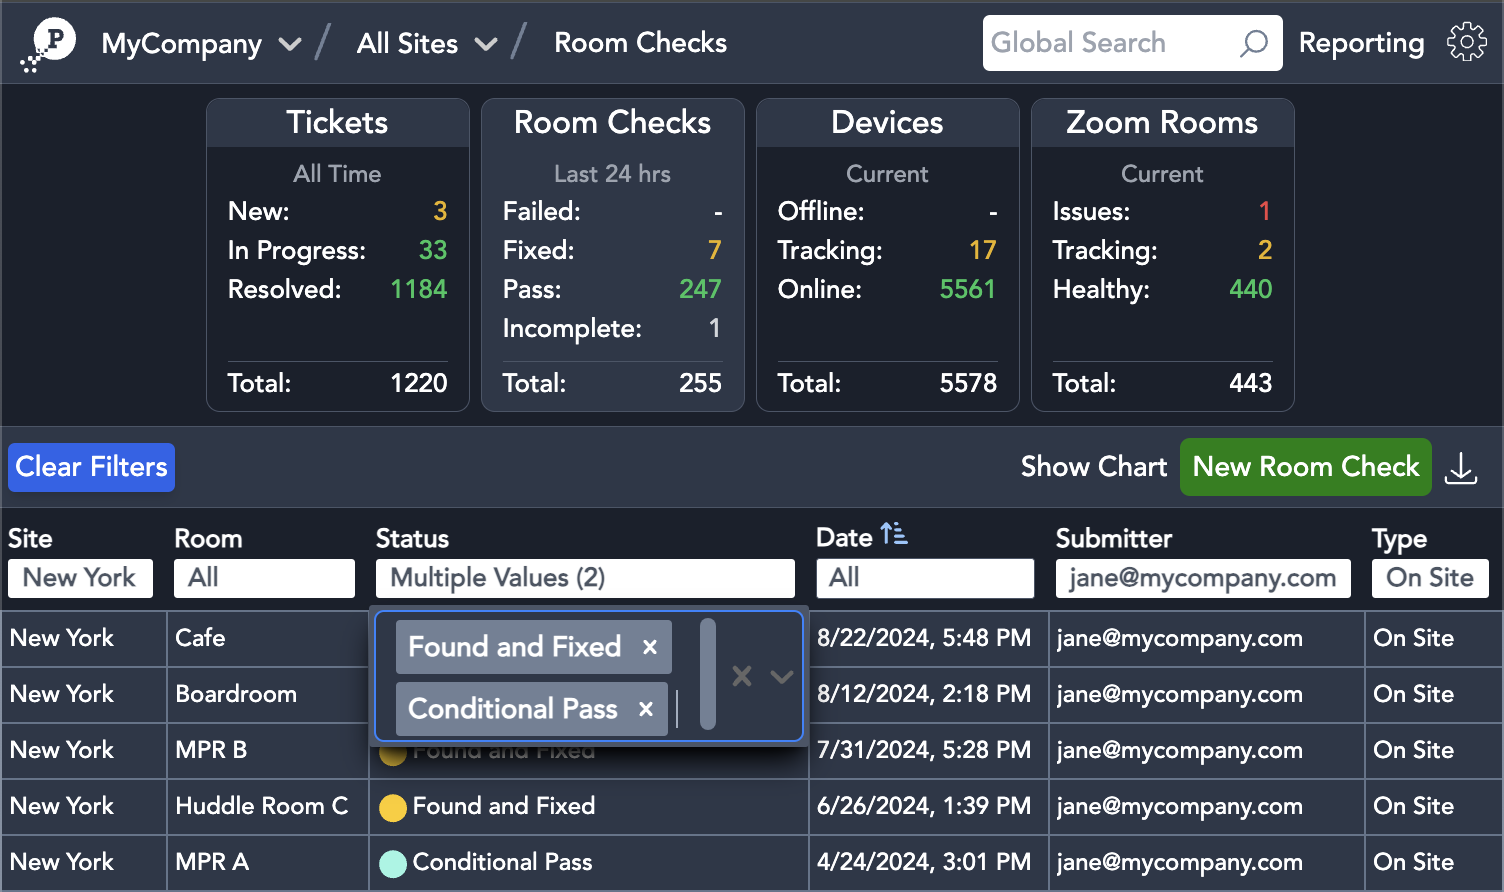
We have heard from various teams that slicing and dicing your data is a must when trying to get to the bottom of complex issues. We’ve removed static filters from our tables, and you can now use column filters to narrow down what you are looking for.

Column filters can be stacked to help you hone in on anything from analyzing inventory, planning for UC Platform software updates, or creating custom metrics.
In the example below we want to find all of the situations in which our team encountered an issue and labeled it "Conditional Pass" or "Found and Fixed".
✏️ Pro Tip!
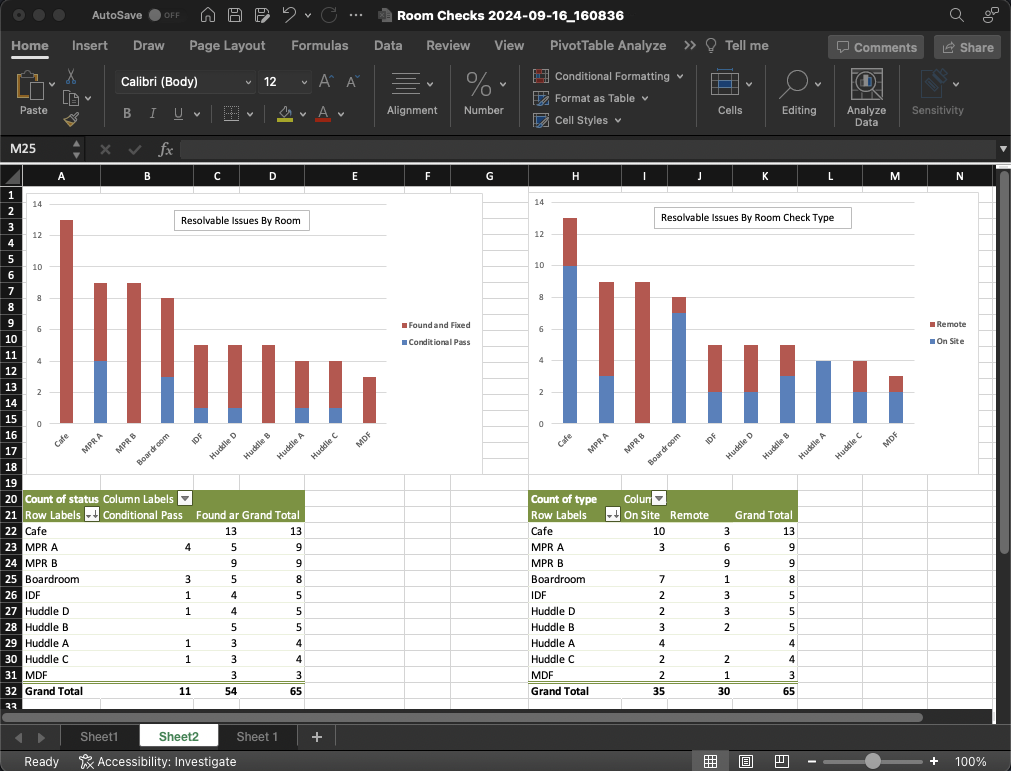
Custom Insights: all module tables are exportable, even after filtering. If we export the table we can create custom insights in any visualization tool. Here we map the "Conditional Pass" and "Found and Fixed" data from before into a chart using a pivot table in Excel. By including the other columns, we can see the Room with the most of these "Warning" checks and whether they were done remotely or in person!

📊 More Report Enhancements!
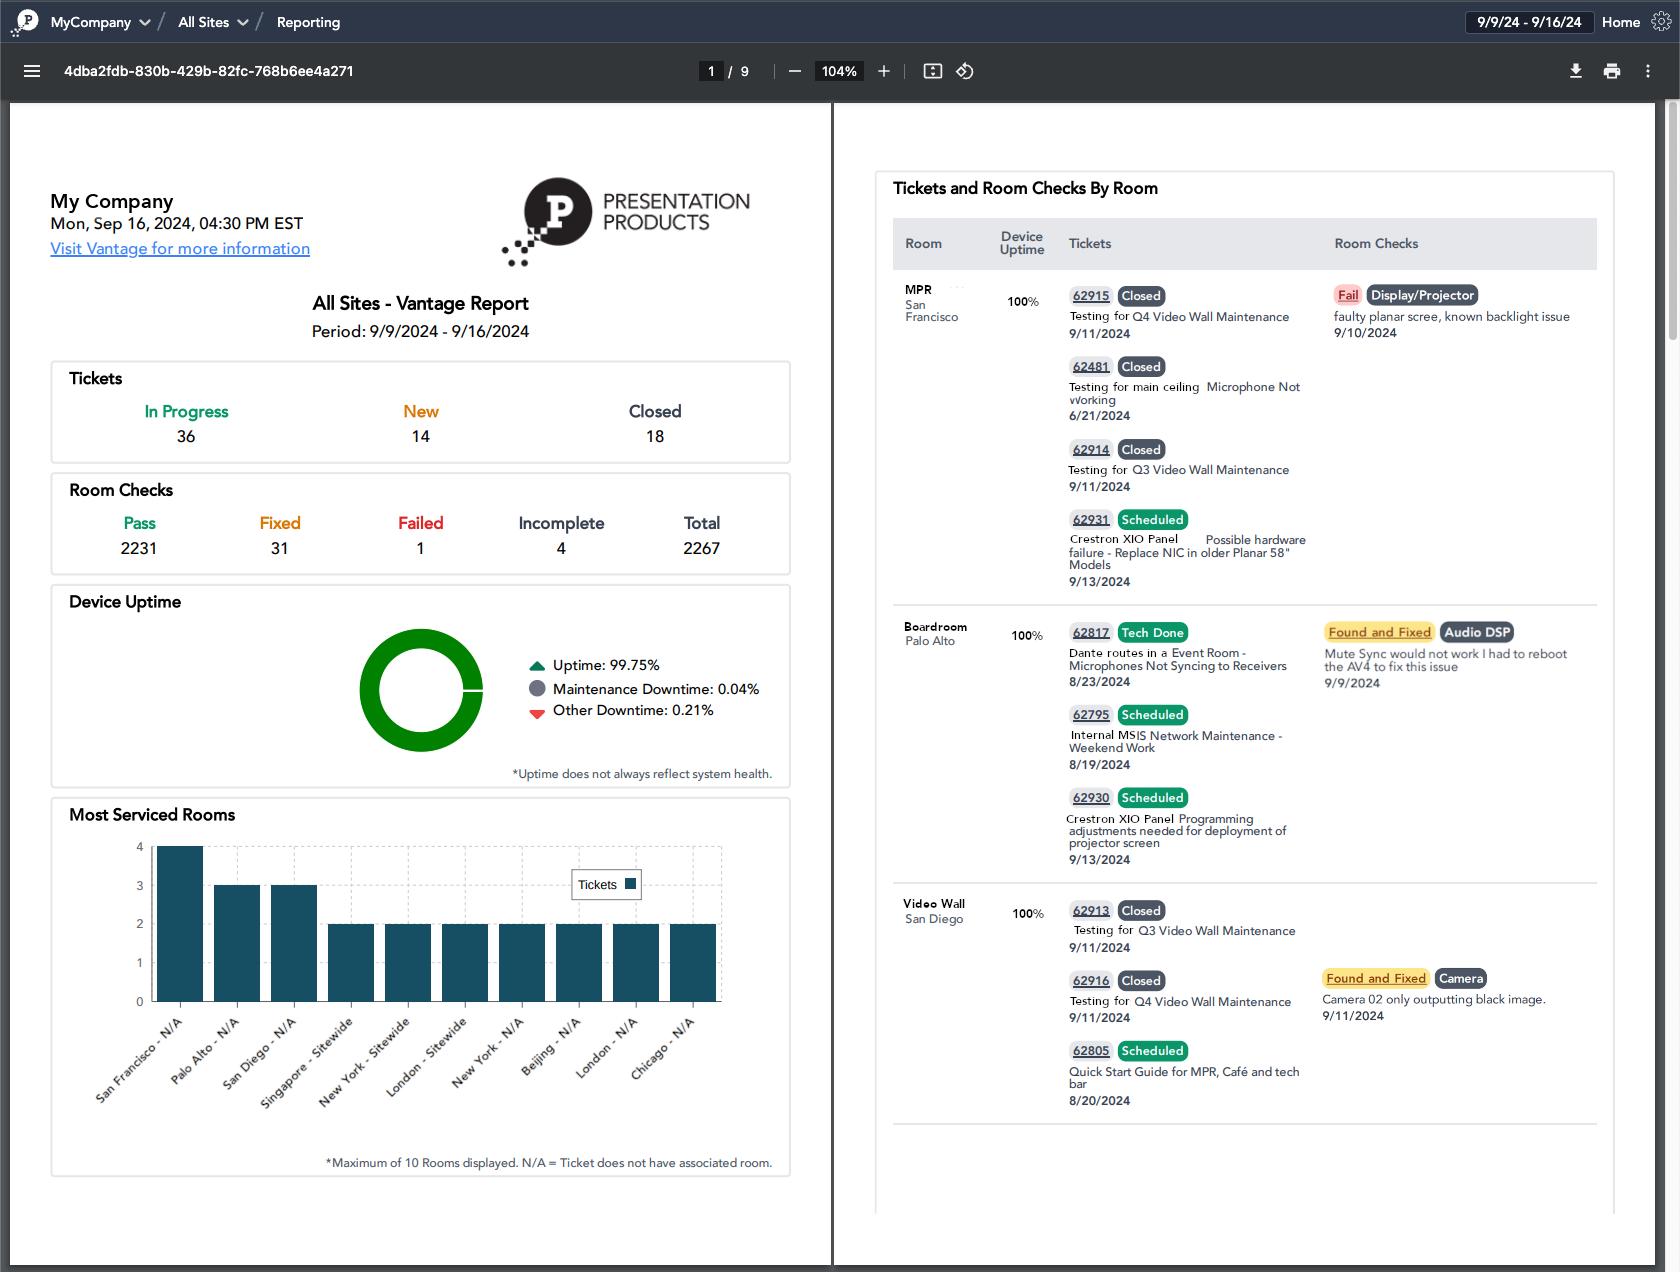
The Vantage Report continues to receive a lot of praise from customers, so we wanted to continue to provide more value here. Now you can view your Site data by Room!

This comes with further insights including device uptime, tickets, and room checks. Seeing your data by room will highlight which systems are seeing the most service activity
Reports still come automatically to your email, but you can always create an ad-hoc report anytime by clicking the “Reporting” button in the menu bar! You can also adjust which dates the report is for or select which site when creating an ad-hoc report!
Adjustments of report delivery options are available via the “My Info” page!
🧹 Docs and Changelog!
We continue to improve our documentation and changelog. These are found under the gear menu on your vantage portal. If you have a question about how something works look here for documentation and if it’s missing make a suggestion using the feedback form!
Take a look at our most recent changelog including various updates and bug fixes.
~September 17, 2024